Layer Descriptions
Lightning
| Content | “GetMap” layer names | Description | Area | Default Time | With TIME Option |
|---|---|---|---|---|---|
| Lightning, cloud strokes | LTGCTC_5MIN
LTGCTC_15MIN LTGCTC_30MIN |
Detected cloud to cloud lightning strokes | North America | Past 5,15, 30 or 60 minutes. | Any interval in past 72 hours |
| Lightning, ground strokes | LTGCTG_5MIN
LTGCTG_15MIN LTGCTG_30MIN LTGCTG_60MIN |
Detected cloud to ground lightning strokes | Global | Past 5,15, 30 or 60 minutes. | Any interval in past 72 hours |
| Lightning density, ground strokes | LTG_DENSITY | Colorized 10-kilometer grids showing frequency of lightning strokes (1 or >1 strokes) | Global | Past 15 minutes | Not applicable |
Radar (Observed Precipitation)
| Content | “GetMap” layer names | Description | Area | Default Time | With TIME Option |
|---|---|---|---|---|---|
| Radar, US | 36 layers: RADAR_US_CURRENT RADAR_US-5MIN … RADAR_US-175MIN |
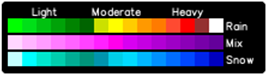
Precipitation detected by radar. Color indicates rain, snow, or ice / rain-snow mix, and shade indicates intensity. | 50 states + Puerto Rico and Guam. Not complete AK coverage. | Past 3 hours in 5 minute layers, 5 minute update | Point or <5 minute interval in past 72 hours |
| Radar, Europe | 36 layers: RADAR_EU_CURRENT RADAR_EU-5MIN … RADAR_EU-175MIN |
Precipitation detected by radar. Color indicates rain, snow, or ice / rain-snow mix, and shade indicates intensity. | Western Europe (see Coverage Area Considerations, later) | Past 3 hours in 5 minute layers, 10 minute update | Point or <5 minute interval in past 72 hours |
| Radar, Canada | 36 layers: RADAR_CN_CURRENT RADAR_CN-5MIN … RADAR_CN-175MIN |
Precipitation detected by radar. Color indicates rain, snow, or ice / rain-snow mix, and shade indicates intensity. | Canada’s radar doesn’t extend to “territories” | Past 3 hours in 5 minute layers, 10 minute update | Point or <5 minute interval in past 72 hours |
| Radar, Australia | 36 layers: RADAR_AU_CURRENT RADAR_AU-5MIN … RADAR_AU-175MIN |
Precipitation detected by radar. Color indicates rain, snow, or ice / rain-snow mix, and shade indicates intensity. | Australia + Norfolk Island | Past 3 hours in 5 minute layers, 10 minute update | Point or <5 minute interval in past 72 hours |
| Radar, Japan | 36 layers: RADAR_JA_CURRENT RADAR_JA-5MIN … RADAR_JA-175MIN |
Precipitation detected by radar. Color indicates rain, snow, or ice / rain-snow mix, and shade indicates intensity. | Japan< | Past 3 hours in 5 minute layers, 5 minute update | Point or <5 minute interval in past 72 hours |
| Radar coverage areas | RADAR_COVERAGE_AREAS | An outline of the various radar coverage areas around the world. This shows the reach of the various radar networks. | US, Canada, Europe, Australia and Japan | Fixed – time is not applicable. | Not applicable |
Storm Corridors
| Content | “GetMap” layer names | Description | Area | Default Time | With TIME Option |
|---|---|---|---|---|---|
| Storm Corridors (Active, Historical) | HEAVYRAIN_CORRIDOR HAIL_CORRIDOR TSTORM_CORRIDOR TORNADO_CORRIDOR HEAVYRAIN_CORRIDOR_HISTORICALHAIL_CORRIDOR_HISTORICALTSTORM_CORRIDOR_HISTORICALTORNADO_CORRIDOR_HISTORICAL |
Radar-based severe storm cell projected movement and speed. The 4 types indicate 4 levels of increasing severity, heavy rain, hail, severe thunderstorms, and possible tornado. | United States | 30 minute projection based on past 5 minutes | Interval in past 72 hours |
Weather Station Observations
| Content | “GetMap” layer names | Description | Area | Default Time | With TIME Option |
|---|---|---|---|---|---|
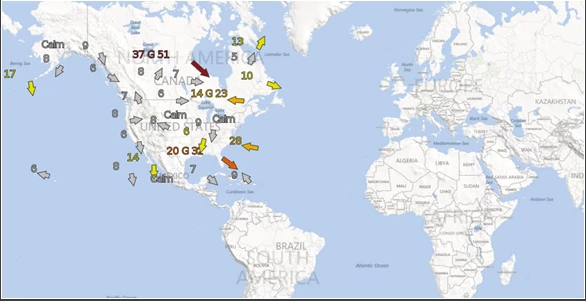
| Current Wind Speed and Direction | SFCOBSWIND_KTS_CURRENT
SFCOBSWIND_MPH_CURRENT SFCOBSWIND_KPH_CURRENT SFCOBSWIND_MPS_CURRENT |
Speed and direction the wind is coming from. Includes wind gusts. In knots (KTS), miles per hour (MPH), kilometers per hour (KPH), or meters per second (MPS). | Global | Last hourly report | Time or <1 hour interval in past 72 hours |
| Current Temperature | TEMPERATURE_F_CURRENT
TEMPERATURE_C_CURRENT |
The observed air temperature, in Fahrenheit (F) or Celsius (C) degrees | Global | Last hourly report | Time or <1 hour interval in past 72 hours |
| Current Dew Point | DEWPOINT_C_CURRENT
DEWPOINT_F_CURRENT |
The absolute temperature at which air can no longer hold all of its water vapor, in Fahrenheit (F) or Celsius (C)degrees | Global | Last hourly report | Time or <1 hour interval in past 72 hours |
| Current Relative Humidity | HUMIDITY_CURRENT | The amount of water vapor in the air. | Global | Last hourly report | Time or <1 hour interval in past 72 hours |
| Current Feels Like Temperature | FEELSLIKETEMP_F_CURRENT
FEELSLIKETEMP_C_CURRENT |
Combines heat index and wind chill. It uses air temperature, relative humidity and wind speed to determine a perceived air temperature. In Fahrenheit (F) or Celsius (C) degrees | Global | Last hourly report | Time or <1 hour interval in past 72 hours |
| Current surface visibility | SFCVIS_MI_CURRENT
SFCVIS_KM_CURRENT SFCVIS_M_CURRENT |
The observed visibility distance at the surface in miles (MI), kilometers (KM) or meters (M). | Global | Last hourly report | Time or <1 hour interval in past 72 hours |
| Current Weather Condition | WEATHER_CONDITION_CURRENT | An icon that summarizes the prevalent weather condition (raining, cloudy, partly sunny, high winds, etc.) | Global | Last hourly report | Time or <1 hour interval in past 72 hours |
Severe Weather Bulletins
| Content | “GetMap” layer names | Description | Area | Default Time | With TIME Option |
|---|---|---|---|---|---|
| NWS bulletins | NWS_WARNINGS
NWS_WATCHES NWS_ADVISORIES NWS_WARNINGS_AMI NWS_ADVISORIES_AMI |
National Weather Service severe weather alert bulletins. Warning indicates in progress. AMI’s are Areas of Maximum Impact for which the NWS provides a more specific geographic for some types of events. | United States | Start and end time is listed in the bulletin (use GetFeatureInfo) | Interval in past 72 hours |
| EUMetNet MeteoAlarm bulletins | METEOALARM_VERYDANGEROUS_TODAY
METEOALARM_POTENTIALLYDANGEROUS_TODAY METEOALARM_DANGEROUS_TODAY METEOALARM_VERYDANGEROUS_TOMORROW METEOALARM_DANGEROUS_TOMORROW METEOALARM_POTENTIALLYDANGEROUS_TOMORROW |
MeteoAlarms are the severe weather alert bulletins from the national meteorological services of Europe, provided by the EUMetNet consortium. There are 3 levels of severity, and they are further divided into time of impact – today and tomorrow. | 29 European countries | Applicable time is listed in the bulletin (use GetFeatureInfo) | Interval in past 72 hours |
Storm Reports / Forecast
| Content | “GetMap” layer names | Description | Area | Default Time | With TIME Option |
|---|---|---|---|---|---|
| Local Storm Reports | STORMREPORTS | Weather damage reports from local emergency management officials. See legend for categories. | United States | Past 24 hours. Reported time of event is listed in GetFeatureInfo | Interval in past 72 hours |
| Thunderstorm Forecast | GBL_THUNDERSTORMS_FCST_06H | Forecast categorical thunderstorms | Global | 6 hours | No |
Satellite (Clouds)
| Content | “GetMap” layer names | Description | Area | Default Time | With TIME Option |
|---|---|---|---|---|---|
| Infrared satellite | 120 layers: INFRAREDSAT_N1_CURRENT INFRAREDSAT_N1-30MIN … INFRAREDSAT_N1-330MINThere are 10 sets of these layers: N1 through N5 (Northern hemisphere) and S1 through S5 (Southern Hemisphere). |
Cloud images from the US GOES satellite system. Around the clock availability, since these are infrared images. Regions are: N1 North Pacific N2 North America N3 Europe N4 India N5 Japan S1 South America S2 South Pacific S3 Africa S4 Indian Ocean S5 Australia |
Global except for poles | Past 6 hours, updated every 30 minutes | Point or <30 minute interval in past 6 hours |
| Visible satellite | 96 layers: VISIBLESAT_N1_CURRENT VISIBLESAT_N1-30MIN … VISIBLESAT_N1-330MINThere are 4 sets of these layers: N1 throughN5 (Northern hemisphere) and S3, S4, and S5 (Southern hemisphere) |
Visible clouds – basically, a picture of the Earth. Valid during daylight hours. Regions are: N1 North Pacific N2 North America N3 Europe N4 India N5 Japan S3 Africa S4 Indian Ocean S5 Australia |
Global except South Pacific, South America, and poles | Past 6 hours, updated every 30 minutes | Point or <30 minute interval in past 6 hours |
Tropical Storm (Hurricane / Typhoon) Forecasts
| Content | “GetMap” layer names | Description | Area | Default Time | With TIME Option |
|---|---|---|---|---|---|
| Tropical, all models track forecasts | TROP_ALL_MODEL_TRACKS_FCST | Forecasted track from all available weather models, for current tropical storm(s). For hurricanes (western hemisphere), typhoons (eastern hemisphere) and tropical storms. | Global | Next 5 days, updated every 6 hours | Not applicable |
| Tropical official track forecast | TROP_OFFICIAL_TRACK_FCST | Forecasted storm track and category, and past positions, for current tropical storm(s) | Global | Next 5 days, updated every 6 hours | Not applicable |
| Tropical, track probability forecast | TROP_TRACK_PROB_FCST | Probability of track, based on the forecasted official storm track, for current tropical storm(s) | Global | Next 5 days, updated every 6 hours | Not applicable |
| Tropical, windspeed forecast | TROP_WINDSPEED_MPH_FCST
TROP_WINDSPEED_KPH_FCST TROP_WINDSPEED_KTS_FCST |
Forecasted maximum wind speed for current tropical storm(s), in miles per hour (MPH), kilometers per hour (KPH), or knots per hour (KTS) | Global | Next 5 days, updated every 6 hours | Not applicable |
| Tropical, rain forecast | TROP_RAIN_IN_FCST
TROP_RAIN_MM_FCST |
Forecasted rainfall accumulations for current tropical storm(s), in inches (IN) or millimeters (MM) | Global | Next 5 days, updated every 6 hours | Not applicable |
| Tropical, wave height forecast | TROP_WAVE_HEIGHT_FT_FCST
TROP_WAVE_HEIGHT_M_FCST |
Forecasted maximum wave heights for current tropical storm(s), in feet (FT) or meters (M) | Global | Next 5 days, updated every 6 hours | Not applicable |
| Tropical, storm surge forecast | TROP_STORM_SURGE_FT_FCST
TROP_STORM_SURGE_M_FCST |
Forecasted maximum storm surge for current tropical storm(s), in feet (FT) or meters (M) | Global | Next 5 days, updated every 6 hours | Not applicable |
Precipitation Forecast
| Content | “GetMap” layer names | Description | Area | Default Time | With TIME Option |
|---|---|---|---|---|---|
| Snow Forecast | SNOW_IN_FCST | Forecast for snow precipitation in inches | North America | 72 hours from current time, updated every hour | Forecast snow for the single hour hh (ccyy-mm-ddThh:mm:ssZ)
OR Forecast accumulated snow between hh and hh (ccyy-mm-ddThh:mm:ssZ/ccyy-mm-ddThh:mm:ssZ) |
| Ice Forecast | ICE_IN_FCST | Forecast for ice precipitation in inches | North America | 72 hours from current time, updated every hour | Forecast ice for the single hour hh (ccyy-mm-ddThh:mm:ssZ)
OR Forecast accumulated ice between hh and hh (ccyy-mm-ddThh:mm:ssZ/ccyy-mm-ddThh:mm:ssZ) |
| Precipitation Forecast | PRECIP_IN_FCST | Combined precipitation forecast for ice, snow and rain in inches | North America | 72 hours from current time, updated every hour | Forecast precipitation for the single hour hh (ccyy-mm-ddThh:mm:ssZ)
OR Forecast accumulated precipitation between hh and hh (ccyy-mm-ddThh:mm:ssZ/ccyy-mm-ddThh:mm:ssZ) |
| Rain Forecast | RAIN_IN_FCST | Forecast for rain precipitation in inches | North America | 72 hours from current time, updated every hour | Forecast precipitation for the single hour hh (ccyy-mm-ddThh:mm:ssZ)
OR Forecast accumulated precipitation between hh and hh (ccyy-mm-ddThh:mm:ssZ/ccyy-mm-ddThh:mm:ssZ) |
Pavement Temperatures
| Content | “GetMap” layer names | Description | Area | Default Time | With TIME Option |
|---|---|---|---|---|---|
| Pavement Temperatures | PAVEMENT_F_OBS | Pavement temperature observations in Fahrenheit | North America | Current time | Not applicable |
Layer legends
Every layer type has its own legend which you may request. See GetCapabilities for the URL for the legend of interest. For example, this is the layer legend for radar:
Coverage Area Considerations
For several different reasons the layer you request may not return information for the entire globe:
- Lightning is available by region, continent or the entire globe.
- Layers may be specific to a certain country, region, or extent; see the Area column of the GetMap (layer) table.
- The package purchase: if you’ve purchased a regional package, the geographic extent of the available weather returned by requests is dictated by that subscription package.
Example: The US/Canada package provides observations for the United States and Canada only.