- Introduction
- DBS Composite Radar Mosaic
- Continuous data ingest
- Premium quality control
- Single Site radar data updates available with each volume scan
- 1 km Composite radar data available every five minutes
- Automatic intensity normalization
- Composite radar expands capabilities
- Base Reflectivity used to construct DBS composite
- 16 Level DTN DBS Composite
- Ground-clutter suppression
- Extended range off coastal shores
- Highest Reflectivity priority
- AP Suppression filtering (US only)
- Remapping into master composite grid
- Five-minute Composite updates
- Summary
- Composite Radar
Introduction
The DTN radar composite is a real-time weather radar service. In all, data from over 200 National Meteorological Services (NMS) radar sites are continuously collected at the DTN central processing facility in the US. Upon receipt of the radar data at DTN, the individual radar images are immediately redistributed to anywhere in North America via internet and satellite communications links. In addition to these “Single-Site” radar images, DTN also offers a mosaic or “composite” radar services which are generated every five minutes. Ground clutter signatures and as much anomalous propagation as possible is withheld from the composite images.This Product Specification describes the radar data files as distributed to customers.
Purpose
This Product Specification describes the radar data files as distributed to customers.
Distribution and formats
All aviation data files are distributed via FTP, web services or AWS S3 buckets in Shapefile, WMS, NetCDF, GeoJSON format.
DBS Composite Radar Mosaic
Continuous data ingest
The continuous nature of the radar data ingest equates to no delays, and no arbitrary decisions being made whether or not to interrogate a radar site. DTN provides continuous weather radar data availability, 24 hours a day.
Premium quality control
All of the radar images used in the DTN service are monitored and quality controlled by NMS personnel at each radar site. DTN ingest software also monitors a wide range of parameters in order to detect problems with communications lines and/or corrupted images. 24 hour a day support from the DTN Computer Operations group, along with the continuous use and monitoring of the data by meteorologists from the DTN Meteorological Operations department, further ensure reliable and consistent product generation and delivery.
Single Site radar data updates available with each volume scan
Radar images update approximately every 5 to 10 minutes depending upon the volume coverage pattern of the radar. Each radar image contains sixteen levels of data, product information identifiers, range designation, site identifier and time stamp. No external processing is applied to DTN Single-Site radar images.
1 km Composite radar data available every five minutes
The NMS 0.5 Degree Base Reflectivity product data is the primary data used to construct the DTN composite radar images. This data provides an effective raw data resolution of one kilometer (0.54 nm). The radar data is also mapped into a master composite grid with a nominal 1 km resolution. The full 1 km data resolution of the composite is available, on a national scale when individual single site radars are used, and 4 km resolution data is used when only previously composited information is used.
Automatic intensity normalization
To assure maximum accuracy, the DTN composite utilizes Sensitivity Time Control (STC) normalized conventional radar images. STC normalization is a process whereby a radar system compensates for the distance from the radar to the target and automatically adjusts the return intensity accordingly. With radar systems that utilize STC normalization, the precipitation reflectivity values of equal intensity echoes remain relatively constant whether distant or close.
Composite radar expands capabilities
Although individual radar images provide a wealth of information, the combining of overlapping, time-synchronized radar images into a mosaic or “composite” radar image can reveal even more meteorological information than can individual radar images. The DTN Composite radar product effectively addresses three specific issues that are sometimes problematic when only single-site radar data is available: attenuation, limited viewing distance and ground clutter.
The intensity of a storm cell and the distance from the radar can contribute to the absorption, scattering, or attenuation of the radar beam energy. Any one of these three physical properties may cause a decrease in the apparent storm intensity. With composite radar, storm activity can be simultaneously interrogated from multiple radar sites from different viewing angles and distances. This provides a more complete picture of the entire storm and also substantially reduces the chances of underestimated storm reflectivity levels due to attenuation.
As a radar beam projects outward from the antenna, it travels at 4/3 the earth’s diameter. Due to the earth’s curvature, the altitude of the radar beam increases as the radar beam travels farther away from the antenna. With a nominal 0.5 degree antenna elevation, at 20 nm from the antenna, the center of the radar beam is approximately 1,300 feet above ground, whereas at a 240 nm distance, the radar beam is approximately 50,800 feet above the ground. Since only rarely does the precipitation within convective storms exceed even 45,000 feet, it is quite common to “overshoot” precipitation located long distances from the radar. However, by utilizing overlapping radar coverage, this problem is all but eliminated. Composite radar images can increase the size of the area that can be effectively monitored for precipitation activity.
Finally, the use of overlapping radars provides an opportunity to eliminate distracting ground clutter patterns. By masking each radar’s ground clutter patterns and including actual precipitation from neighboring radar’s, one can effectively depict actual precipitation events in and around areas of ground clutter.
Base Reflectivity used to construct DBS composite
In addition to proper time synchronization, it is imperative that the radar reflectivity’s being represented by the different types of radars be derived from similar radar antenna scanning elevations. DTN utilizes the 0.5-degree Base Reflectivity data for inclusion into the DBS composite product. Since the nominal operating antenna elevation for the existing network of NMS radar’s is also 0.5 degree, an appropriate match of antenna elevations is achieved. Use of any other scanning elevation and/or use of the WSR-88D composite reflectivity product would introduce inconsistencies.
16 Level DTN DBS Composite
DTN produces a high-resolution 16 level master grid composite of all the NMS radars in the continental United States. The 16 level composite is available as a gridded data file, and also as a contoured GIS shape file.
The 16 level composite master grid, which has a filename extension of .MNG, consists of one square kilometer data (the same as RADAR single site) with 16 levels (from 0dbz to 75dbz in 5dbz increments).
The MNG product has a separate color for no data coverage, as opposed to no radar echoes. Areas that are not covered by any radar are assigned a different color than areas which have coverage but where no precipitation is detected. A rain/snow mask is also applied to the data, so that the 16-reflectivity levels of data are assigned a value based on whether they depict rain, snow, or a mix:
| Level | Precipitation Type | Depiction |
|---|---|---|
|
0 |
No Precipitation |
Clear |
|
1 – 15 |
Rain |
5 – 75dbz |
|
16 |
No Radar Coverage |
|
|
17 – 31 |
Rain/Snow Mix |
5 – 75dbz |
|
33 – 47 |
Snow |
5 – 75dbz |
Ground-clutter suppression
Conventional weather radars are most sensitive to precipitation-sized particles. However, at times they can also detect nearby objects such as high elevation terrain features, buildings and other ground features. This “ground clutter” generally provides little usable information and may present a confusing display, as it is often difficult to differentiate between actual precipitation and ground clutter close to the radar. The NMS Radars are equipped to remove most, if not all, of the ground clutter pattern that is quite specific to each site.
Extended range off coastal shores
DTN composites incorporate supplemental NMS 248 nm radar range data along the coastlines when it is available, providing extended coverage offshore. This extended range data is only used to supplement coverage beyond the range of the 124 nm data in the US. Extended offshore radar coverage provides enhanced early surveillance capabilities, particularly tropical storms and hurricanes.
Highest Reflectivity priority
The large number of radar sites used in the DTN system allows for the interrogation of a particular area of precipitation from multiple radar installations. The one-kilometer raw radar data resolution and precise master grid remapping allow for overlapping radars to “see” a particular storm cell from different viewpoints. For a given element of precipitation, the highest DVIP reflectivity level detected and validated by any of the surrounding radar sites is used in the composite. This presents a “worst case” composite radar image.
AP Suppression filtering (US only)
Certain atmospheric conditions can cause a radar beam to curve downward toward the ground, resulting in a false, typically high reflectivity return, in clear air. This anomalous propagation (AP) usually occurs during quiet evenings when low-level temperature inversions are present. In addition, unusual air pressure and water vapor patterns are also factors contributing to the occurrence of AP.
The approach to AP suppression used in DTN is based upon sound meteorological reasoning and is not vaguely disguised as some mysterious proprietary algorithm (as some vendors have) that are little more than a subjective “scrubbing” of the data. WSR-88D data affords the opportunity to interrogate different elevations within a single volume scan to objectively identify false radar returns. A statistical analysis of the radar data is performed, and the results of that analysis are used to remove AP from the image(s). The methodology employed is patterned after methods currently in test at the National Weather Service. DBS Composite also employs the use of high spatial resolution real-time surface thermodynamic analyses, along with current and time interpolated forecast upper atmospheric temperature fields, combined with ground-corrected GOES infrared satellite data. These data fields make possible the objective and highly accurate determination of cloud existence. During evening and early morning hours, when AP is most likely to exist, a continuously updating cloud information table is compared to the radar reflectivity values. In simple terms, if radar reflectivity values exist where it is known that clouds do not exist, the reflectivity values are deemed to be AP and are restricted from becoming a part of the DTN Composite images.
Remapping into master composite grid
The DTN composite system continuously updates a master composite grid containing the time-synchronized overlapping radar reflectivity values from throughout the region. The rectilinear master composite grid containing nearly 30 million discrete data points is updated every five minutes. The master composite grid is based upon a spherical equidistant projection as to best preserve distance relationships between points.
For any given radar image, there exist over 200,000 possible points (pixels) where valid reflectivity values can exist. Each of these points has a fixed latitude/longitude and, subject to validation, is remapped into their AP suppression filter corresponding master grid location. This master grid is then contoured into a GIS shape file.
Five-minute Composite updates
DTN national and regional composite images are produced every five minutes. This compares to 15-minute updates from other vendors and hourly updates from the NMS radar summary products.
Excellent time synchronization of the radar data has been achieved in the DTN composite images. The first available “valid” radar image from each site during each five-minute period is used in the composite. Typically, about 95% of the radar data used in the DTN composites are within 1.5 minutes of each other. The completed composite images are synchronized and time-stamped to the top of the hour and each five minutes thereafter (i.e. 00, 05, 10, etc.).
Summary
The DTN single site and composite radar system represents the most comprehensive real-time weather radar service available anywhere. DTN has made an enormous commitment towards quality control and the ability to provide continuous data access. The continuous collection and redistribution of the latest value added composite radar updated every 5 minutes provides unparalleled real-time access to the entire NMS radar network.
Composite Radar
Geographies
- Continental United States
- Alaska
- Hawaii
- Guam
- Puerto Rico
- Canada
- Europe
- Australia
- Northern Islands of Australia
- Japan
Data values
| Grid Value | Definition | Mode | Grid Value | Definition | Mode |
|---|---|---|---|---|---|
|
0 |
0 DBZ |
rain/snow/mix |
|
|
|
|
1 |
5 DBZ |
rain |
33 |
5 DBZ |
mix |
|
2 |
10 DBZ |
rain |
34 |
10 DBZ |
mix |
|
3 |
15 DBZ |
rain |
35 |
15 DBZ |
mix |
|
4 |
20 DBZ |
rain |
36 |
20 DBZ |
mix |
|
5 |
25 DBZ |
rain |
37 |
25 DBZ |
mix |
|
6 |
30 DBZ |
rain |
38 |
30 DBZ |
mix |
|
7 |
35 DBZ |
rain |
39 |
35 DBZ |
mix |
|
8 |
40 DBZ |
rain |
40 |
40 DBZ |
mix |
|
9 |
45 DBZ |
rain |
41 |
45 DBZ |
mix |
|
10 |
50 DBZ |
rain |
42 |
55 DBZ |
mix |
|
11 |
55 DBZ |
rain |
43 |
55 DBZ |
mix |
|
12 |
60 DBZ |
rain |
44 |
60 DBZ |
mix |
|
13 |
65 DBZ |
rain |
45 |
65 DBZ |
mix |
|
14 |
70 DBZ |
rain |
46 |
70 DBZ |
mix |
|
15 |
75 DBZ |
rain |
47 |
75 DBZ |
mix |
|
16 |
NO DATA |
rain |
48 |
0 DBZ |
mix |
|
17 |
5 DBZ |
snow |
|
undefined |
|
|
18 |
10 DBZ |
snow |
50 |
undefined |
|
|
19 |
15 DBZ |
snow |
51 |
undefined |
|
|
20 |
20 DBZ |
snow |
52 |
undefined |
|
|
21 |
25 DBZ |
snow |
53 |
undefined |
|
|
22 |
30 DBZ |
snow |
54 |
undefined |
|
|
23 |
35 DBZ |
snow |
55 |
undefined |
|
|
24 |
40 DBZ |
snow |
56 |
undefined |
|
|
25 |
45 DBZ |
snow |
57 |
undefined |
|
|
26 |
50 DBZ |
snow |
58 |
undefined |
|
|
27 |
55 DBZ |
snow |
59 |
undefined |
|
|
28 |
60 DBZ |
snow |
60 |
undefined |
|
|
29 |
65 DBZ |
snow |
61 |
undefined |
|
|
30 |
70 DBZ |
snow |
62 |
undefined |
|
|
31 |
75 DBZ |
snow |
63 |
undefined |
|
|
32 |
0 DBZ |
snow |
|
|
|
Coverage Areas
The graphics below detail the exact coverage areas of our radar data.
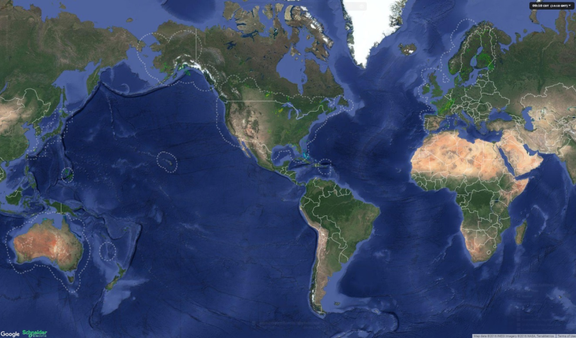
Global
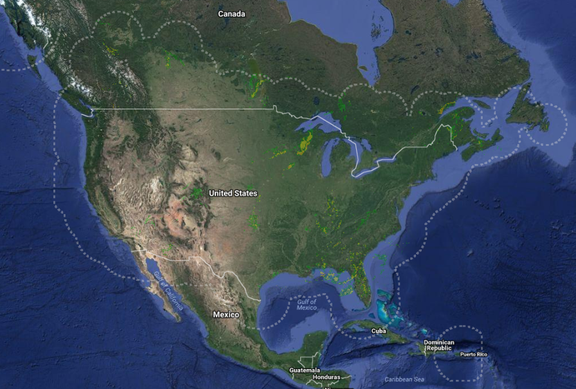
Continental United States, Canada, and Puerto Rico
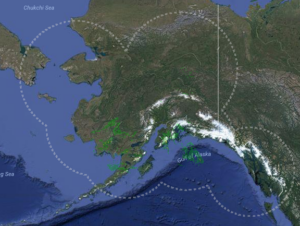
Alaska
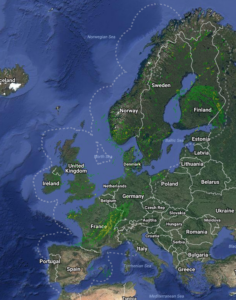
Europe
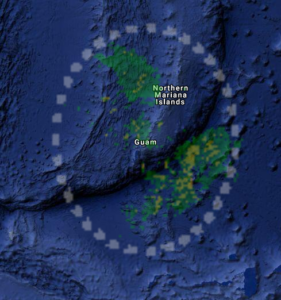
Guam
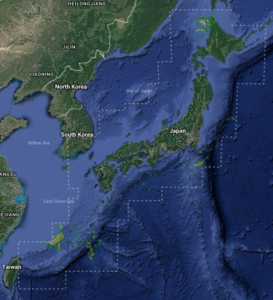
Japan
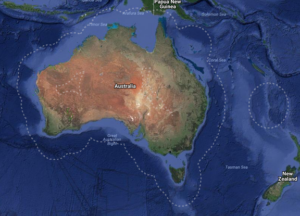
Australia